
- Proceed either north or south on highway 101
- From highway 101 turn west on Great America Pkwy in Santa Clara
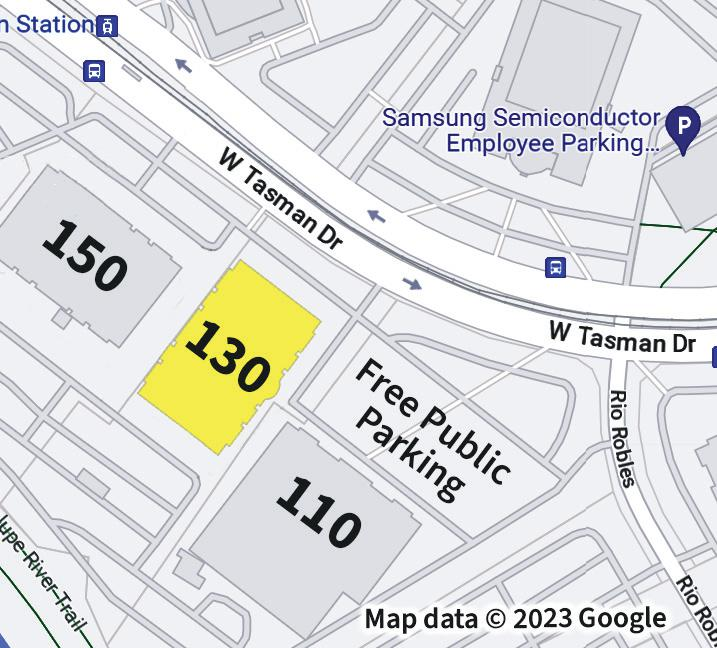
- In 1.1 miles, turn right onto Tasman Dr.
- In 1.6 miles, turn right into the 130 & 110 Tasman driveway.
- The Assessor’s Office will be on the right and free public parking will be on the left.
Every year we work to continuously improve the report and if you have suggestions please do not hesitate to let our office know.
Every year we work to continuously improve the report and if you have suggestions please do not hesitate to let our office know.
Every year we work to continuously improve the report and if you have suggestions please do not hesitate to let our office know.
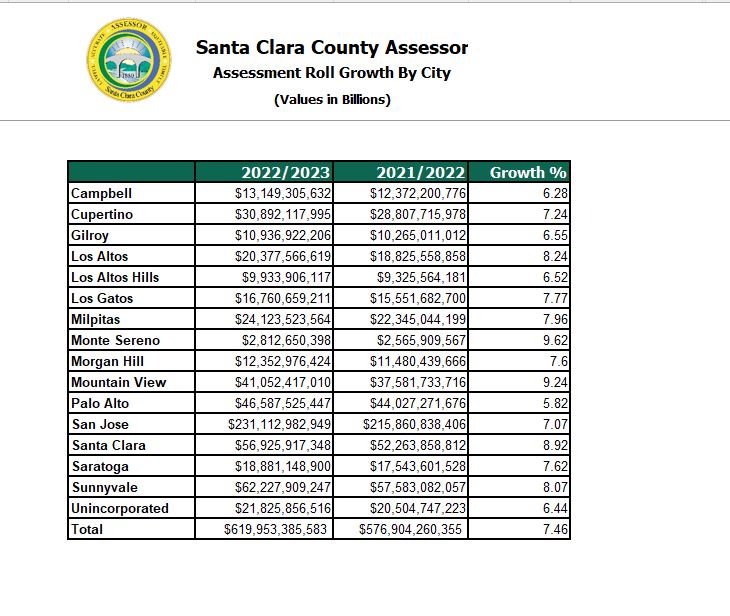
Silicon Valley has a unique resilience to economic downturns. Challenged by the worst pandemic in 100 years, the Santa Clara County economy has continued to grow, exceeding expectations. The strength of the region’s underlying fundamentals is reflected in the annual assessment roll released by Santa Clara County Assessor Larry Stone earlier today.
The 2022-2023 assessment roll reflects the total net assessed value of all real and business property in Santa Clara County as of the January 1, 2022 lien date. This year’s roll reached a record $619.9 billion, a 7.46% increase over the prior year, the fourth highest percentage increase in the last 10 years.
“This time last year, the nation was in the middle of an economic crisis triggered by the COVID-19 pandemic,” said Stone. “Vaccine availability, and a $3 trillion federal stimulus prevented a major collapse of the U.S. economy.” The impact of the “Great Recession”, which started in 2008, lasted approximately six years. Comparatively, the COVID-19 recession was the deepest, yet the shortest recession, in economic history.
The growth in property assessed values is attributed to multiple factors. The leading contributors are changes in ownership and new construction, which accounted for $24.5 billion and $5.9 billion of the total increase, respectively. The pace of new construction is gaining momentum following the uncertainty of the economic and business outlook during COVID-19. Platform 16, the 1.1 million square foot office project in San Jose, resumed construction after it was shut down during the pandemic, a testament to the strength of Santa Clara County office demand, and a clear indication that the COVID-19 recession was receding. Another notable example is the Nvidia Campus in Santa Clara, which accounted for $310 million of the County’s $5.9 billion in new construction, boosting the City of Santa Clara’s assessment roll growth to 8.92% compared to the County’s total of 7.46%.
Silicon Valley is poised for unprecedented new development, as evidenced by the May 2021 approval of the Google Downtown West project, the largest single development in San Jose history.
Technological innovation continues to generate significant investment in the region, including $3.5 billion of office and commercial building acquisitions last year.
The final component of the 2022-2023 assessment roll growth is the increase in the assessed value of properties with no new activity or transactions. Proposition 13 limits the assessment of those properties to the California Consumer Price Index (CCPI) or 2%, whichever is lower. A rebounding economy throughout 2021 added $11 billion to the assessment roll.
“Even when real estate values are soaring, Proposition 13 limits the increase in assessment to 2%, a significant financial benefit to property owners,” said Stone.
As homeowners benefit from the difference between assessed values and market values, it comes at a cost to schools and local governments dependent on property tax revenue to provide quality education and public services.
Silicon Valley was not entirely immune to the pandemic recession. Many sectors including hospitality, brick and mortar retail, restaurants and entertainment, all suffered financially.
When the market value of a property is lower than the current assessed value, the owner can request, or the Assessor can proactively undertake, a Proposition 8 (Prop. 8) review of the assessment. “In 2020, my office launched multiple programs to assist property owners and businesses seriously impacted by COVID-19,” said Stone. The Assessor’s Office requested information and data from businesses to determine the financial impact of the pandemic on the value of commercial property and used that information to implement proactive assessment reductions where warranted. As the market value increases, the Prop. 8 reduction in assessment value will ultimately be restored.
Of the 2,595 properties in Prop. 8 decline status, 18% are commercial properties, a majority of which qualified because of the impact of the pandemic. “As Assessor, my job is to get it right. When the market value of a property declines below the original purchase price, we lower the assessment,” said Stone.
“The COVID-19 crisis required a course correction. Last year, we feared the recession would extend for a longer period of time, and I projected a pessimistic view for recovery. The resilience of Silicon Valley coupled with an extraordinarily strong residential market have reinforced the local economy, accelerating growth in the assessment roll to a record level,” said Stone.
At over $1.7 million, Santa Clara County has the second highest increase in median home price in the Bay Area, up more than 17% year over year. Prices of condominiums are up 11%.
This year started with a strengthening economy due to broad vaccine distribution, trillions of dollars of federal and state stimulus, pent-up demand in both the residential and corporate sectors, and low interest rates,” said Stone. “However, the 2022-2023 assessment roll is a snapshot of property values as of January 1, 2022. Recently, mortgage interest rates have doubled and inflation has reduced consumer buying power, indicating that next year we may see a flattening of growth.”
The major beneficiaries of property tax revenue are public schools, community colleges, cities, and Santa Clara County. Fifty percent of local property tax revenue generated in Santa Clara County goes to fund public education. Property owners can also access an on-line tool provided by the County Finance Agency to learn exactly how much of their property taxes go to neighborhood public schools, community colleges and government agencies, including the 15 cities and county government
Requesting a Temporary Reduction in Assessed Value
“As Assessor, my responsibility is to ensure that accurate values are enrolled based upon market conditions. When market value (as of January 1, 2022) falls below the existing assessment, my office is required by law to temporarily reduce the assessed value to reflect the declining market value,” said Stone. Property owners who demonstrate their assessment is higher than the market value of their property are encouraged to request an informal review of their assessment. “My appraisal staff will complete as many informal reviews as possible prior to August 1, the deadline for making changes that will be reflected on the property tax bill mailed in the fall,” said Stone. To apply for a reduction go to: https://www.sccassessor.org/prop8
Annual Notification of Assessed Value
On June 30, the Assessor’s Office mailed annual assessment notices to 496,445 property owners, reporting each property’s 2022 assessed value. The notice serves as the basis for the property tax bill. Santa Clara County is one of only ten counties in California which provides early notice to property owners. “Most property owners in California learn of their assessed value for the first time when they receive their property tax bill in October,” said Stone.
Property owners who disagree with the assessed value printed on the notice, are encouraged to take advantage of the Assessor’s “online tool,” available 24/7, enabling property owners to review the sale of comparable properties used to determine their assessment. This interactive service modeled after online banking, the Opt-In Tool, allows taxpayers to securely receive assessment notices, in addition to interacting with the Assessor’s Office electronically rather than by mail, telephone, or in person. To access the data, a property owner must have a username and password created last year, or the PIN listed on the annual assessment notice. To login go to: https://www.sccassessor.org/index.php/online-services/email-opt-in/email-opt-in-login
The annual notice also describes the process for filing a formal assessment appeal by the September 15, 2022 deadline. Residential property owners who decide to file a formal appeal, are encouraged to request their appeal be adjudicated by an independent residential Value Hearing Officer (VHO), rather than the more formal three-member Assessment Appeals Board. VHO hearings are scheduled frequently, allowing for a more rapid resolution.
“Property owners who disagree with the assessed value should not wait for the tax bill before filing an appeal, as the tax bill is mailed by the Tax Collector after the assessment appeal filing deadline,” said Stone. More information is available from the Clerk of the Board by calling (408) 299-5088, or going to their website:http://www.sccgov.org/assessmentappeals
More information about the Assessor’s Office is available at www.sccassessor.org.